← REPORTS · EQUITIES · 10 October 2026
Week ending 9 Oct 2026: S&P 500 +1.2%, a broad rise
The week in one number
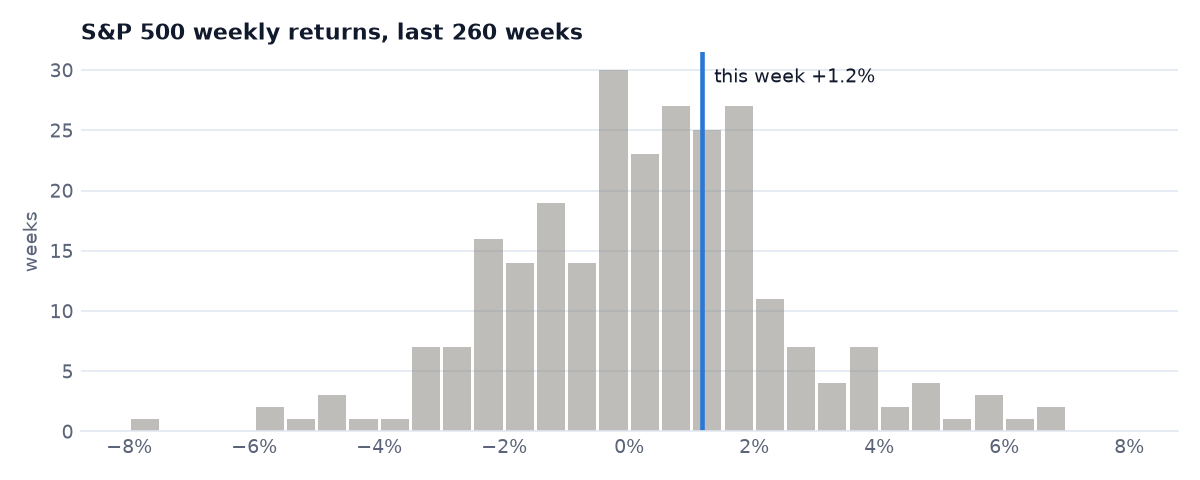
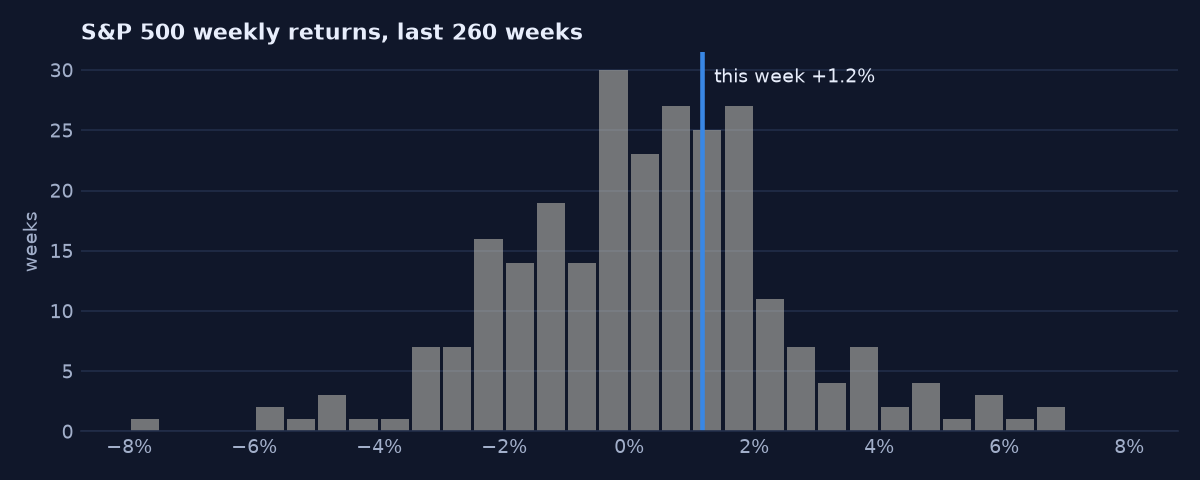
The S&P 500 (SPY) moved +1.2% this week. Measured against its own volatility over the past year that is a 0.7σ week, and over the last 262 weeks a move at least this large, either way, happened about 1 week in 2.
Indices and assets
| Week | Year to date | |
|---|---|---|
| S&P 500 (SPY) | +1.2% | +15.1% |
| S&P 500 equal weight (RSP) | +1.6% | +12.5% |
| Nasdaq 100 (QQQ) | +0.2% | +22.7% |
| Russell 2000 small caps (IWM) | -0.9% | +14.1% |
| Dow Jones (DIA) | +1.0% | +8.6% |
| 20+ year Treasuries (TLT) | +0.6% | -7.4% |
| Gold (GLD) | +1.2% | -3.0% |
| VIX (volatility index, level) | 14.8 (-0.5 pts) | — |
Sectors
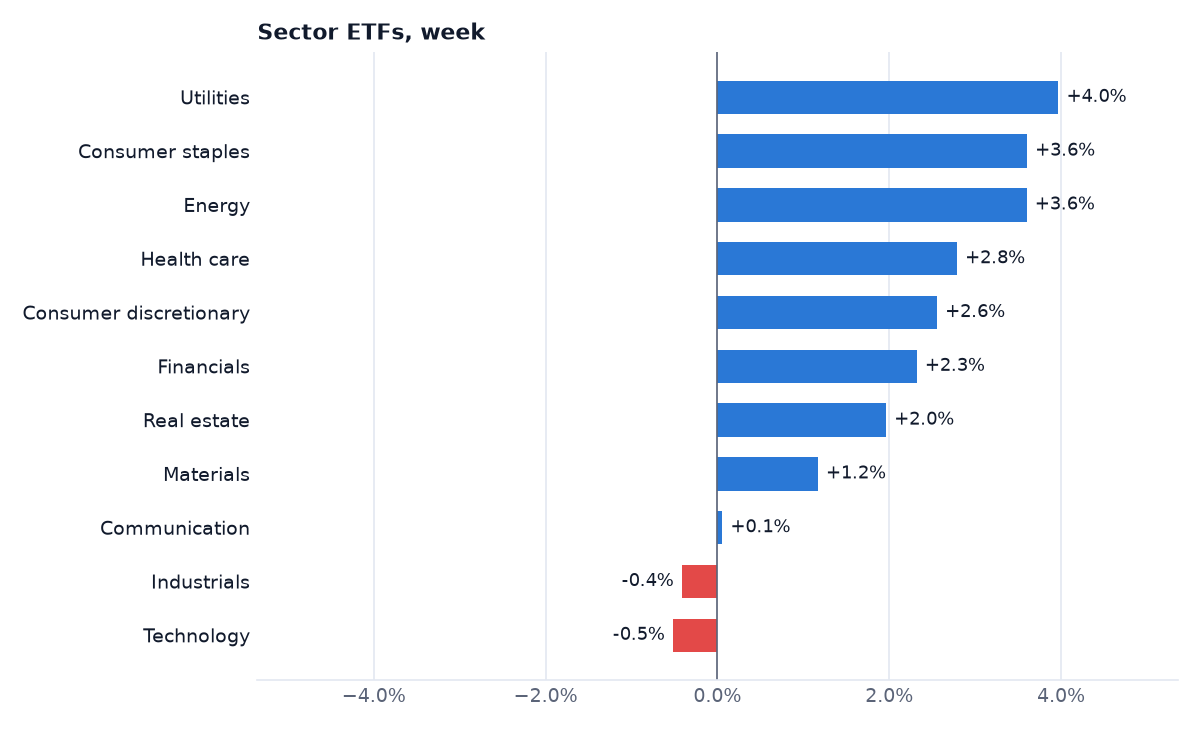
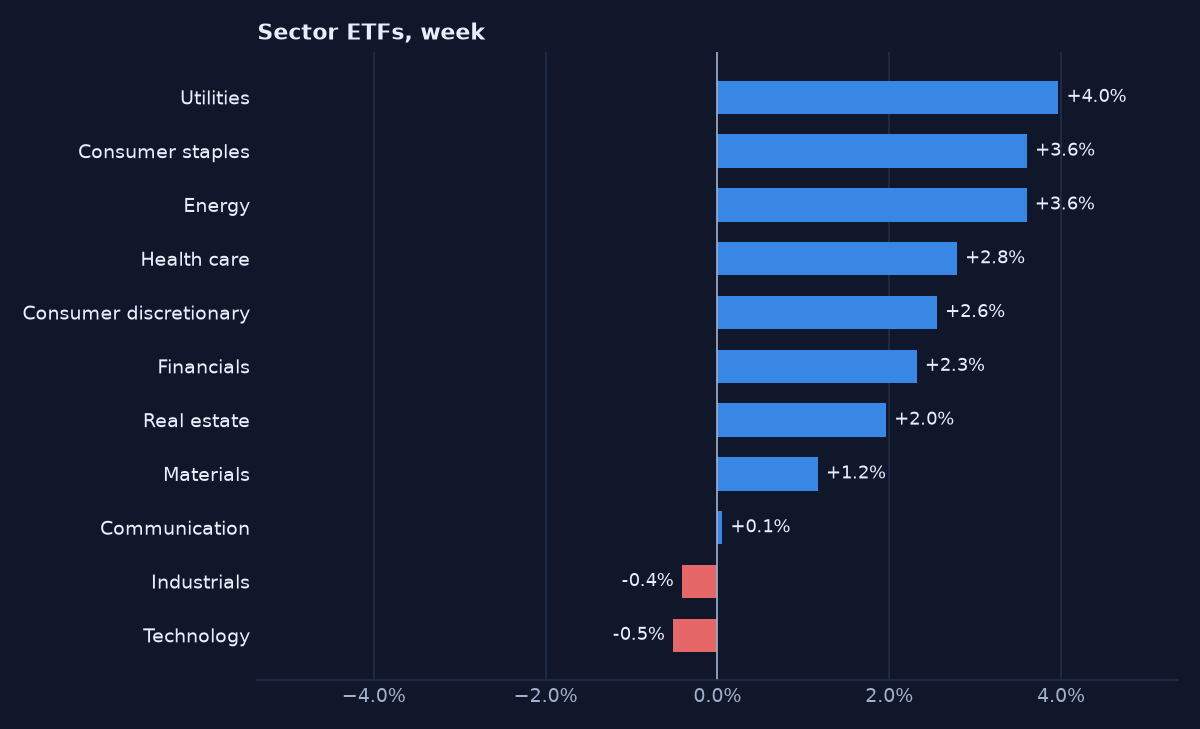
Utilities led (+4.0%) and Technology lagged (-0.5%): a spread of 4.5 percentage points between the best and worst sector.
| Sector ETF | Week | 4 weeks | 13 weeks | Rank over the 13 weeks before |
|---|---|---|---|---|
| Utilities (XLU) | +4.0% | -1.6% | -8.1% | 11 of 11 |
| Consumer staples (XLP) | +3.6% | +0.7% | -0.2% | 6 of 11 |
| Energy (XLE) | +3.6% | +0.5% | +18.9% | 1 of 11 |
| Health care (XLV) | +2.8% | +3.7% | +6.6% | 3 of 11 |
| Consumer discretionary (XLY) | +2.6% | +0.1% | -3.5% | 8 of 11 |
| Financials (XLF) | +2.3% | -4.1% | -1.4% | 5 of 11 |
| Real estate (XLRE) | +2.0% | -3.4% | -5.6% | 10 of 11 |
| Materials (XLB) | +1.2% | -2.5% | -2.4% | 7 of 11 |
| Communication (XLC) | +0.1% | -1.6% | -0.8% | 4 of 11 |
| Industrials (XLI) | -0.4% | -1.5% | -6.7% | 9 of 11 |
| Technology (XLK) | -0.5% | +6.0% | +7.1% | 2 of 11 |
Utilities, this week's best sector, was 11th of 11 over the 13 weeks before; Technology, the worst, was 2nd. One week's order says little on its own: the longer columns show which moves are new and which continue.
Under the surface
Of the 518 stocks in our S&P 500 universe, 70% rose, and 53% beat the index itself. The typical (median) stock moved +1.6%, the average (equal-weight) stock +1.5%.
The S&P 500 (+1.2%) trailed its equal-weight version (RSP, +1.6%), which gives every member the same weight, by 0.4 percentage points: the largest companies did worse than the typical member. A gap at least this wide, either way, came in 83% of the past 52 weeks (typical: 1.0 percentage point).
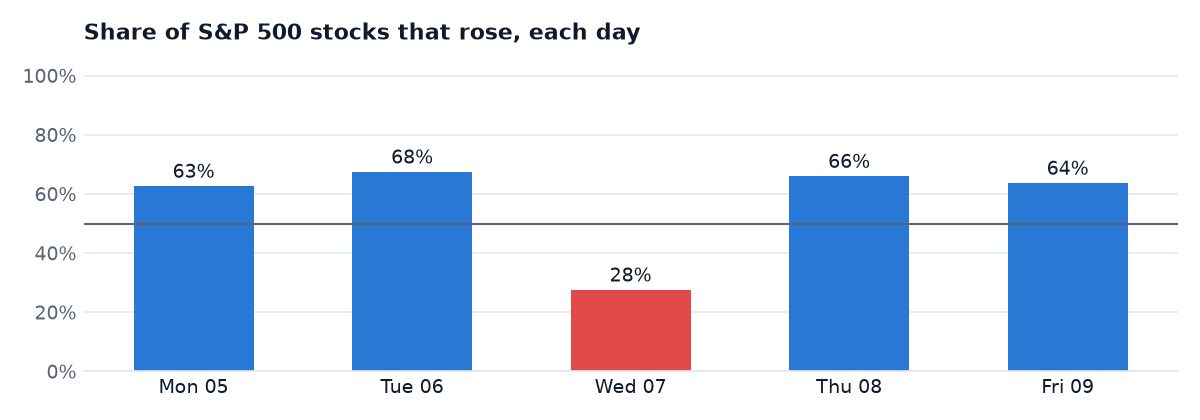
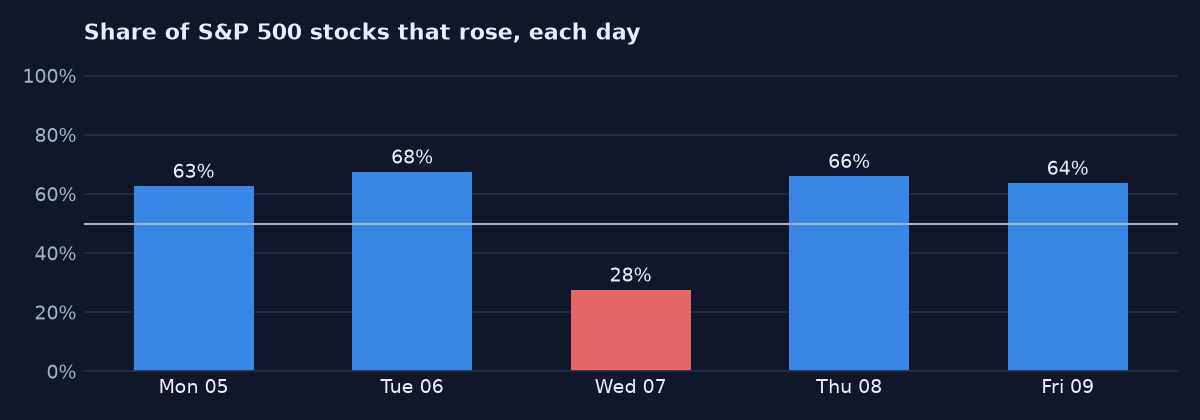
The spread between winners and losers (the gap between the stock at the 75th percentile and the one at the 25th) was 4.3%, narrower than 67% of the past year's weeks (typical: 4.7%). 30 stocks closed at a 52-week high during the week and 29 at a 52-week low.
| Sector | Stocks | Median stock | Share that rose |
|---|---|---|---|
| Communications | 44 | +3.4% | |
| Energy | 22 | +3.3% | |
| Consumer, Non-cyclical | 102 | +2.7% | |
| Utilities | 31 | +2.6% | |
| Basic Materials | 17 | +1.3% | |
| Financial | 95 | +0.9% | |
| Consumer, Cyclical | 57 | +0.9% | |
| Technology | 68 | +0.9% | |
| Industrial | 82 | +0.0% |
The luck check
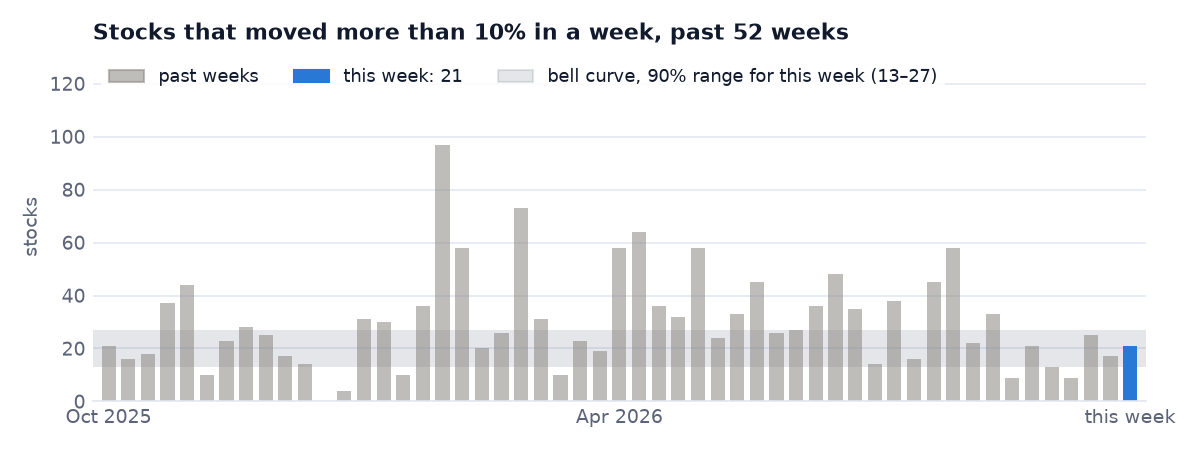
21 stocks moved more than 10% this week (16 up, 5 down). If each stock's weekly return were an independent draw from a bell curve with its usual weekly swing, we would expect about 19.7. That is close to this simple model's expectation (it puts 90% of weeks between 13 and 27), so the count alone gives little evidence that the week was unusual. It cannot show the opposite either: the model treats stocks as independent, and they are not.
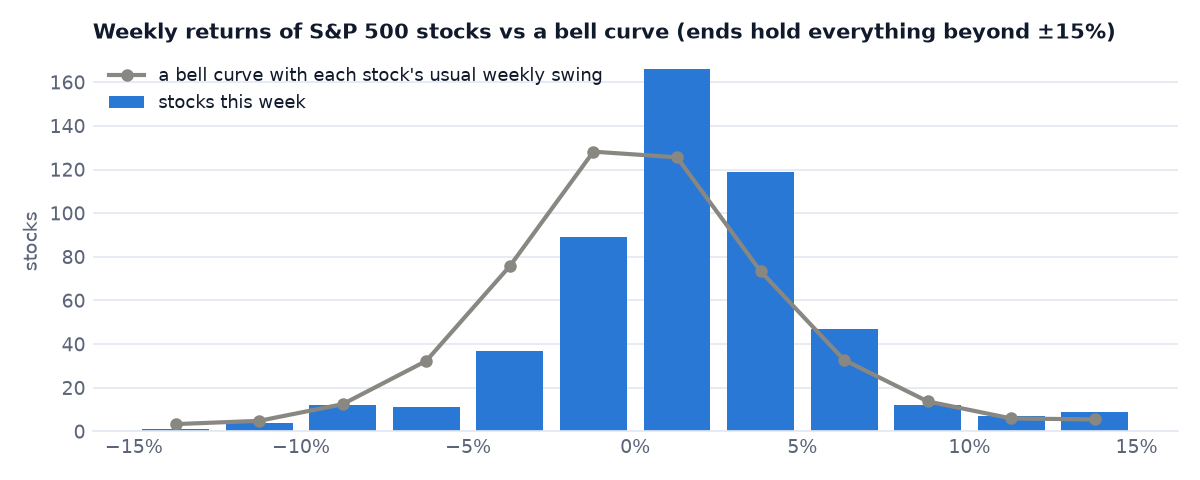
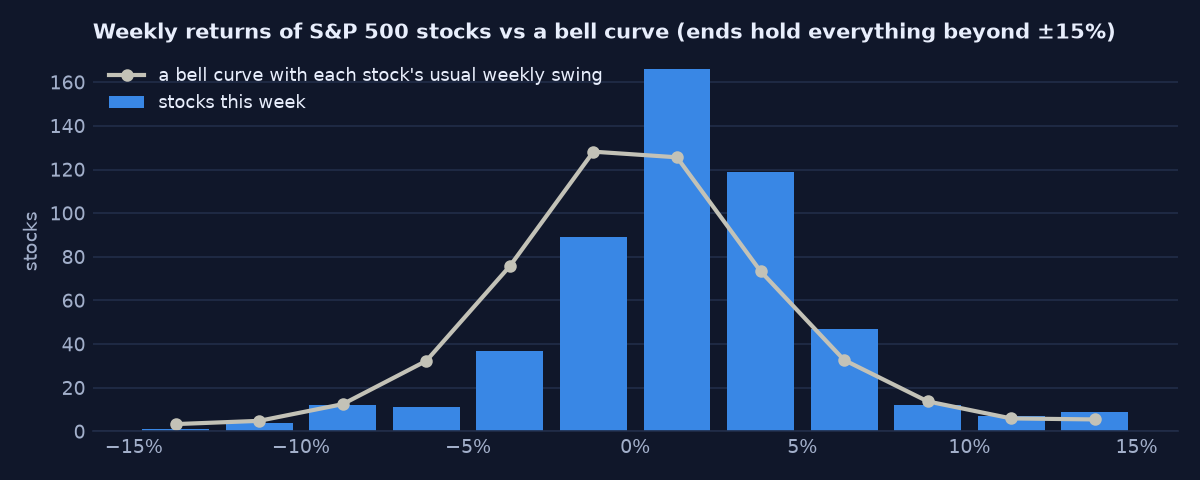
Measured against the past instead of a model: over the last 52 weeks the count was typically 26, and this week's 21 was higher than in 33% of them and lower than in 63%.
Biggest movers
| Gainers | Sector | Week |
|---|---|---|
| PTC | Technology | +35.0% |
| CCI | Financial | +19.9% |
| MRNA | Consumer, Non-cyclical | +18.4% |
| CEG | Utilities | +15.8% |
| VST | Utilities | +15.3% |
| Losers | Sector | Week |
|---|---|---|
| ARM | Technology | -13.4% |
| INTC | Technology | -12.3% |
| MOS | Basic Materials | -11.1% |
| TER | Technology | -10.3% |
| SWKS | Technology | -10.2% |
PTC jumped after Schneider Electric agreed to buy it for $205 a share in cash, a 42% premium to its previous close.
Last week's movers, one week on
| Last week's mover | Was a | Last week | This week |
|---|---|---|---|
| CCL | gainer | +15.8% | +2.3% |
| LITE | gainer | +15.3% | +1.7% |
| SNPS | gainer | +15.1% | +4.1% |
| RCL | gainer | +14.4% | +1.6% |
| COHR | gainer | +13.9% | -7.2% |
| FICO | loser | -23.4% | +1.0% |
| ALNY | loser | -14.2% | +5.9% |
| APP | loser | -13.7% | +3.3% |
| GPN | loser | -9.4% | +4.9% |
| WDC | loser | -9.1% | -4.3% |
4 of last week's 5 biggest gainers rose again this week (average +0.5%); 1 of last week's 5 biggest losers fell again this week (average +2.1%). Five names a side is far too few to say whether big weekly moves tend to continue or reverse: the record builds up week by week.
What this week does not tell us
- A +1.2% week means the market has turned up. 59% of the past 262 weeks moved at least this much either way, so this was an ordinary week, and one week says little about the next.
- The equal-weight index beating the S&P 500 means the typical stock has taken over from the largest companies. The gap was 0.4 percentage points, and 83% of the past 52 weeks had a gap at least that wide: well within normal variation.
- 70% of stocks rising means the market is healthy underneath. The spread between winners and losers was narrower than usual (4.3% against a typical 4.7%), and fewer stocks moved more than 10% than in 63% of past weeks. It was a broad but calm week, which says little about the weeks ahead.
- Utilities, consumer staples and energy rising most means money is moving into defensive sectors. Utilities went from last of 11 over the previous 13 weeks to first this week, while energy was already first. One week cannot tell a lasting shift from noise.
Scheduled next week
- JNJ reports earnings on Tue 13 Oct
- JPM reports earnings on Tue 13 Oct
- UNH reports earnings on Tue 13 Oct
- BAC reports earnings on Wed 14 Oct
Data: index, sector, VIX and named-stock prices from Yahoo Finance (adjusted closes); breadth, dispersion, highs and lows and the luck check computed from unadjusted daily closes of the 518 stocks in our S&P 500 universe (the US stocks our trading database tracks, with each share class counted (FOX/FOXA, NWS/NWSA); this list is not reconciled with the index's official constituents for the week, and at 518 it is larger than the index's ~503 lines, so it includes some stocks that are not current members), published as aggregates only. Weeks run Friday close to Friday close. Not investment advice.