← REPORTS · EQUITIES · 03 October 2026
Week ending 2 Oct 2026: S&P 500 -0.2%, a mixed week
The week in one number
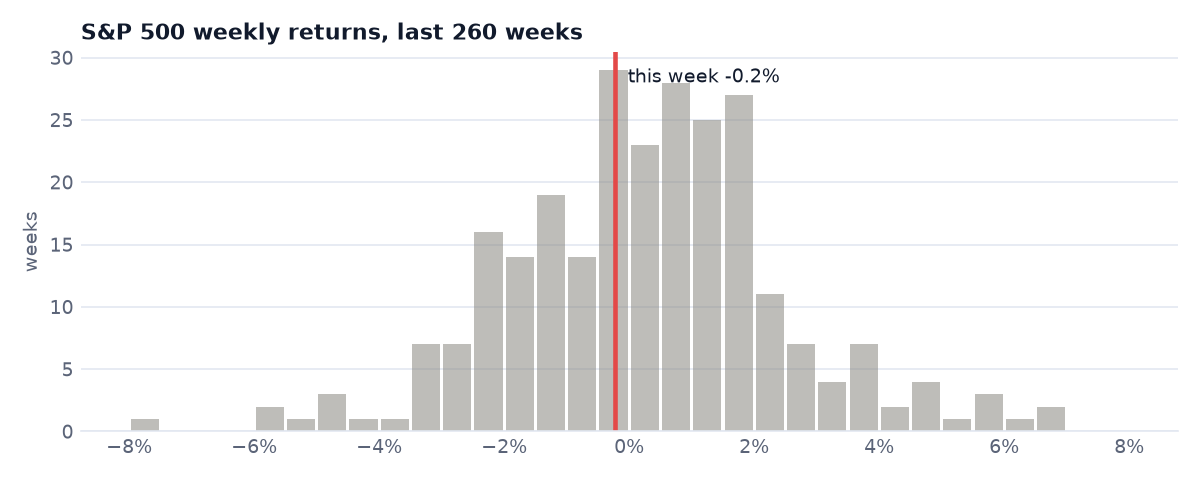
The S&P 500 (SPY) moved -0.2% this week. Measured against its own volatility over the past year that is a 0.1σ week, and over the last 262 weeks a move at least this large, either way, happened most weeks.
Indices and assets
| Week | Year to date | |
|---|---|---|
| S&P 500 (SPY) | -0.2% | +13.7% |
| Nasdaq 100 (QQQ) | +0.7% | +22.4% |
| Russell 2000 small caps (IWM) | -0.2% | +15.1% |
| Dow Jones (DIA) | -1.2% | +7.5% |
| 20+ year Treasuries (TLT) | -1.9% | -8.0% |
| Gold (GLD) | -3.4% | -4.1% |
| VIX (volatility index, level) | 15.3 (+0.4 pts) | — |
Sectors
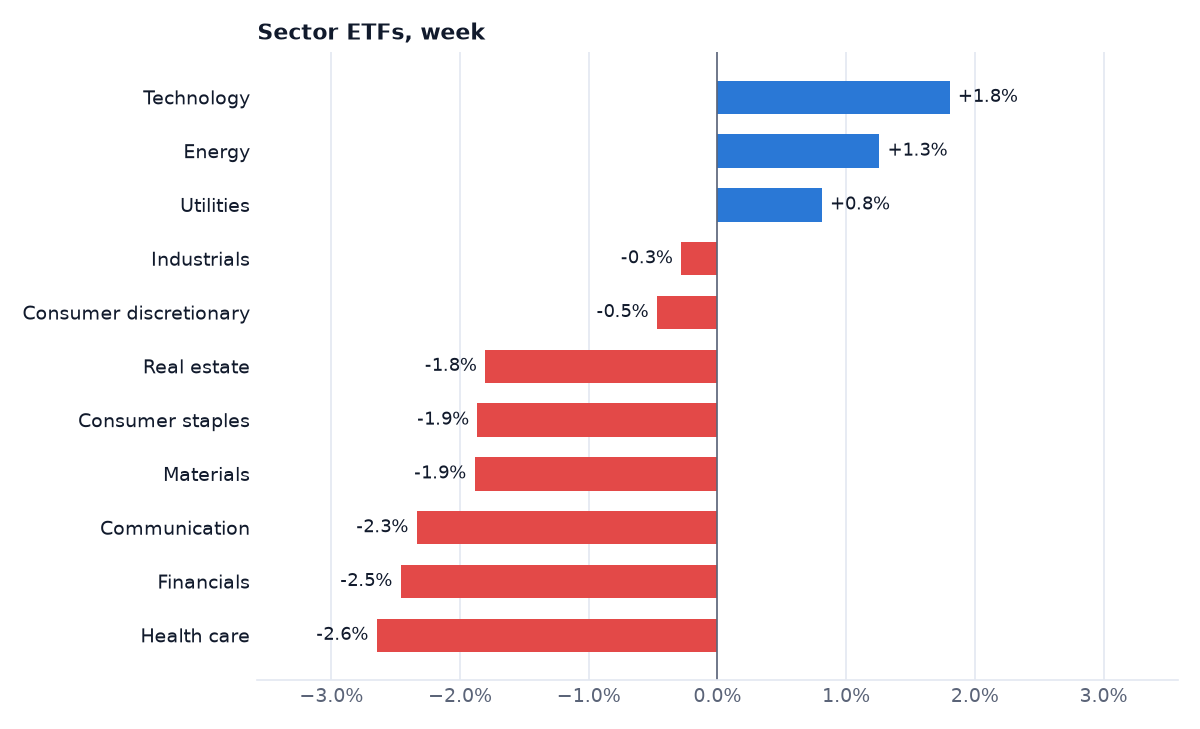
Technology led (+1.8%) and Health care lagged (-2.6%): a spread of 4.5 percentage points between the best and worst sector.
Under the surface
Of the 517 stocks in our S&P 500 universe, 34% rose, and 38% beat the index itself. The typical (median) stock moved -1.1%, the average (equal-weight) stock -0.7%.
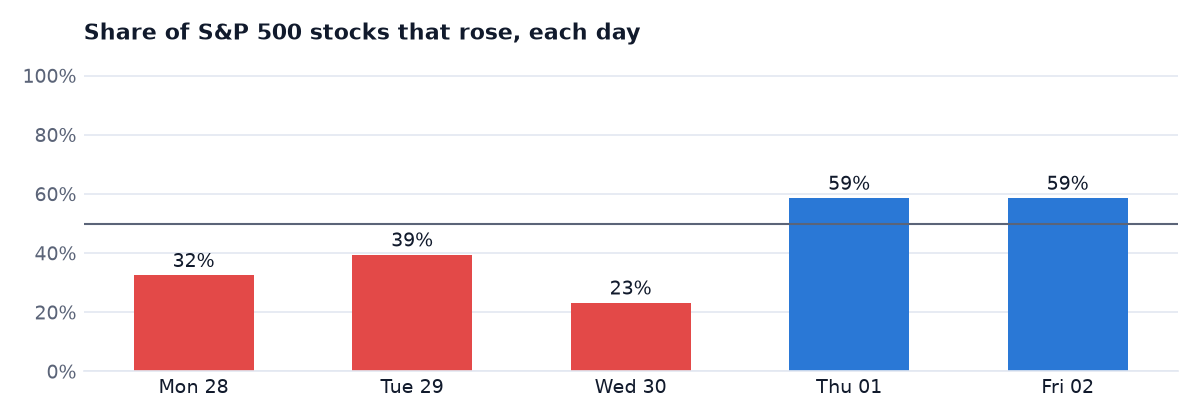
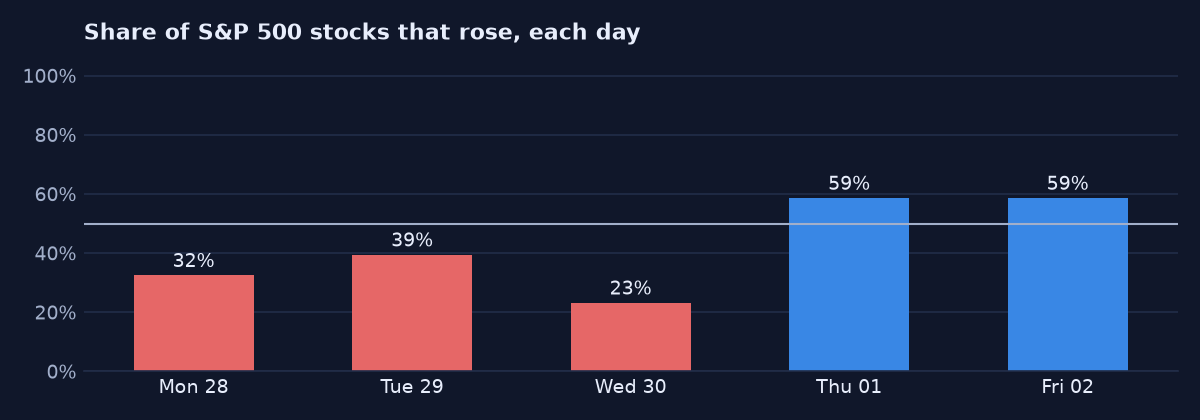
The spread between winners and losers (the gap between the stock at the 75th percentile and the one at the 25th) was 4.0%, narrower than 83% of the past year's weeks (typical: 4.7%). 20 stocks closed at a 52-week high during the week and 71 at a 52-week low.
| Sector | Stocks | Median stock | Share that rose |
|---|---|---|---|
| Utilities | 31 | +1.0% | |
| Technology | 67 | +0.9% | |
| Energy | 22 | +0.9% | |
| Industrial | 82 | -0.4% | |
| Communications | 45 | -1.3% | |
| Consumer, Cyclical | 57 | -1.3% | |
| Basic Materials | 17 | -2.1% | |
| Consumer, Non-cyclical | 101 | -2.1% | |
| Financial | 95 | -2.2% |
The luck check
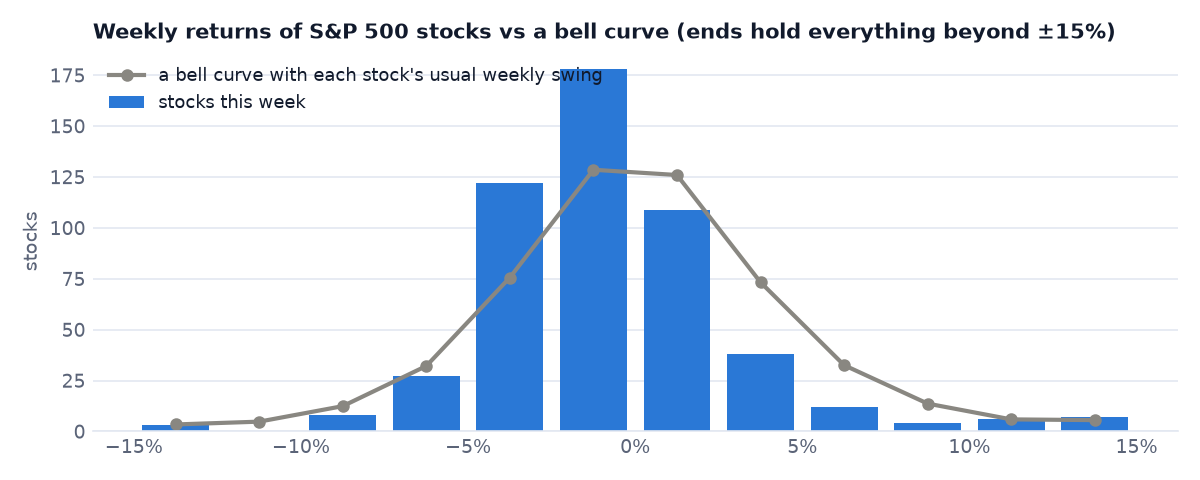
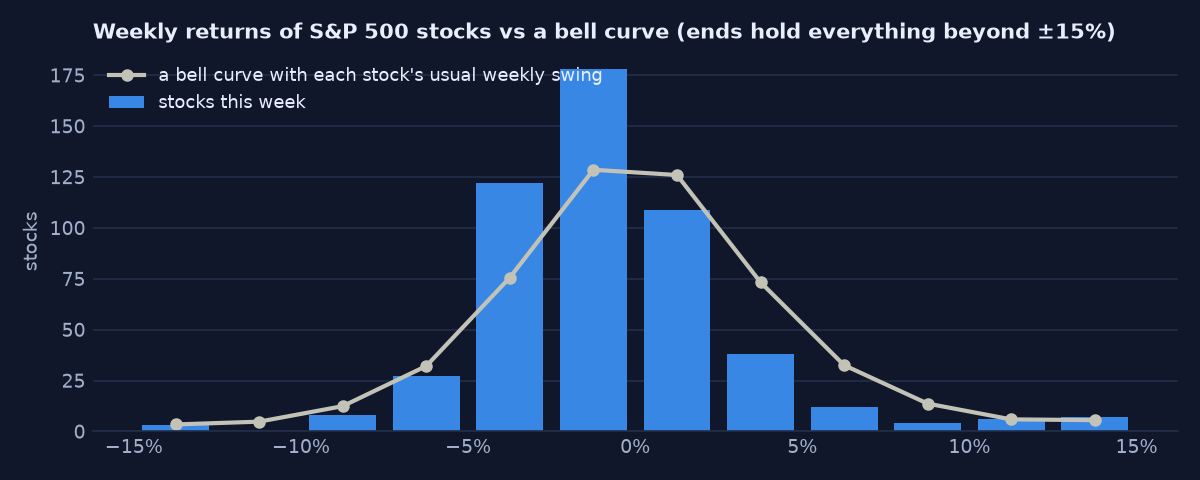
16 stocks moved more than 10% this week (13 up, 3 down). If each stock's weekly return were an independent draw from a bell curve with its usual weekly swing, we would expect about 19.8. That is close to this simple model's expectation (it puts 90% of weeks between 13 and 27), so the count alone gives little evidence that the week was unusual. It cannot show the opposite either: the model treats stocks as independent, and they are not.
Biggest movers
| Gainers | Sector | Week |
|---|---|---|
| CCL | Consumer, Cyclical | +15.8% |
| LITE | Technology | +15.3% |
| SNPS | Technology | +15.1% |
| RCL | Consumer, Cyclical | +14.4% |
| COHR | Industrial | +13.9% |
| Losers | Sector | Week |
|---|---|---|
| FICO | Technology | -23.4% |
| ALNY | Consumer, Non-cyclical | -14.2% |
| APP | Communications | -13.7% |
| GPN | Consumer, Non-cyclical | -9.4% |
| WDC | Technology | -9.1% |
What this week does not tell us
- Small overall market move: The S&P 500 fell by just 0.22%, a move smaller than 92% of past weeks, so this week does not provide strong evidence of a new trend or regime change in the market.
- Sector performance differences: Technology and Energy sectors rose modestly while Financials and Health Care declined, but these mixed results over one week cannot reliably indicate a durable sector rotation or leadership shift.
- Low market breadth: Only about 34% of stocks rose and the median stock declined by 1.1%, yet the S&P 500 was almost flat; this divergence could reflect a few large stocks offsetting broad weakness, but one week is too short to conclude anything about market health.
- Number of big movers within normal range: Sixteen stocks moved more than 10%, close to the 13–27 range expected from the model, so the amount of extreme individual stock moves this week does not signal unusual market stress or exuberance.
Data: index, sector, VIX and named-stock prices from Yahoo Finance (adjusted closes); breadth, dispersion, highs and lows and the luck check computed from unadjusted daily closes of the 517 stocks in our S&P 500 universe (the US stocks our trading database tracks, with each share class counted (FOX/FOXA, NWS/NWSA); this list is not reconciled with the index's official constituents for the week, and at 517 it is larger than the index's ~503 lines, so it includes some stocks that are not current members), published as aggregates only; left out of every figure above, because a weekly price change beyond ±50% reflects a corporate action or a bad print rather than what shareholders gained or lost: CTVA (spun off Vylor, one VYLR share per CTVA share, 1 Oct 2026). Weeks run Friday close to Friday close. Not investment advice.